 ×
×
The preview will close once the visualization is loaded
These visualizations explore the network of book subjects and their interrelations, thus challenging genre boundaries.
"To read is to struggle to name, to subject the sentences of a text to a semantic transformation." Roland Barthes
This visualization explores the network of book subjects and their interrelations, thus challenging genre boundaries.
Our research initially focused on genres and sales to evaluate book readers' interests. However, it became clear that genre is a social construct, and there are many ways to interpret it. That led us to adopt another approach: concentrating on common genre tag words used to describe and categorize books.
Rather than thinking about connections as a whole, the visualization describes them from two sides: one is to understand the tags for a single book (network), and the other is to see what books are under a tag (genre tag library).
Network: By analyzing the top 200 book subjects from Open Library API, we uncovered a complex network of interconnected themes and categories. This layout shows which tag words are popular to describe books in general and what tag words popular books share in common.
Our interactive network maps the relationships between subjects and their most-sold books, filtered to include the top 30 bestsellers per subject.
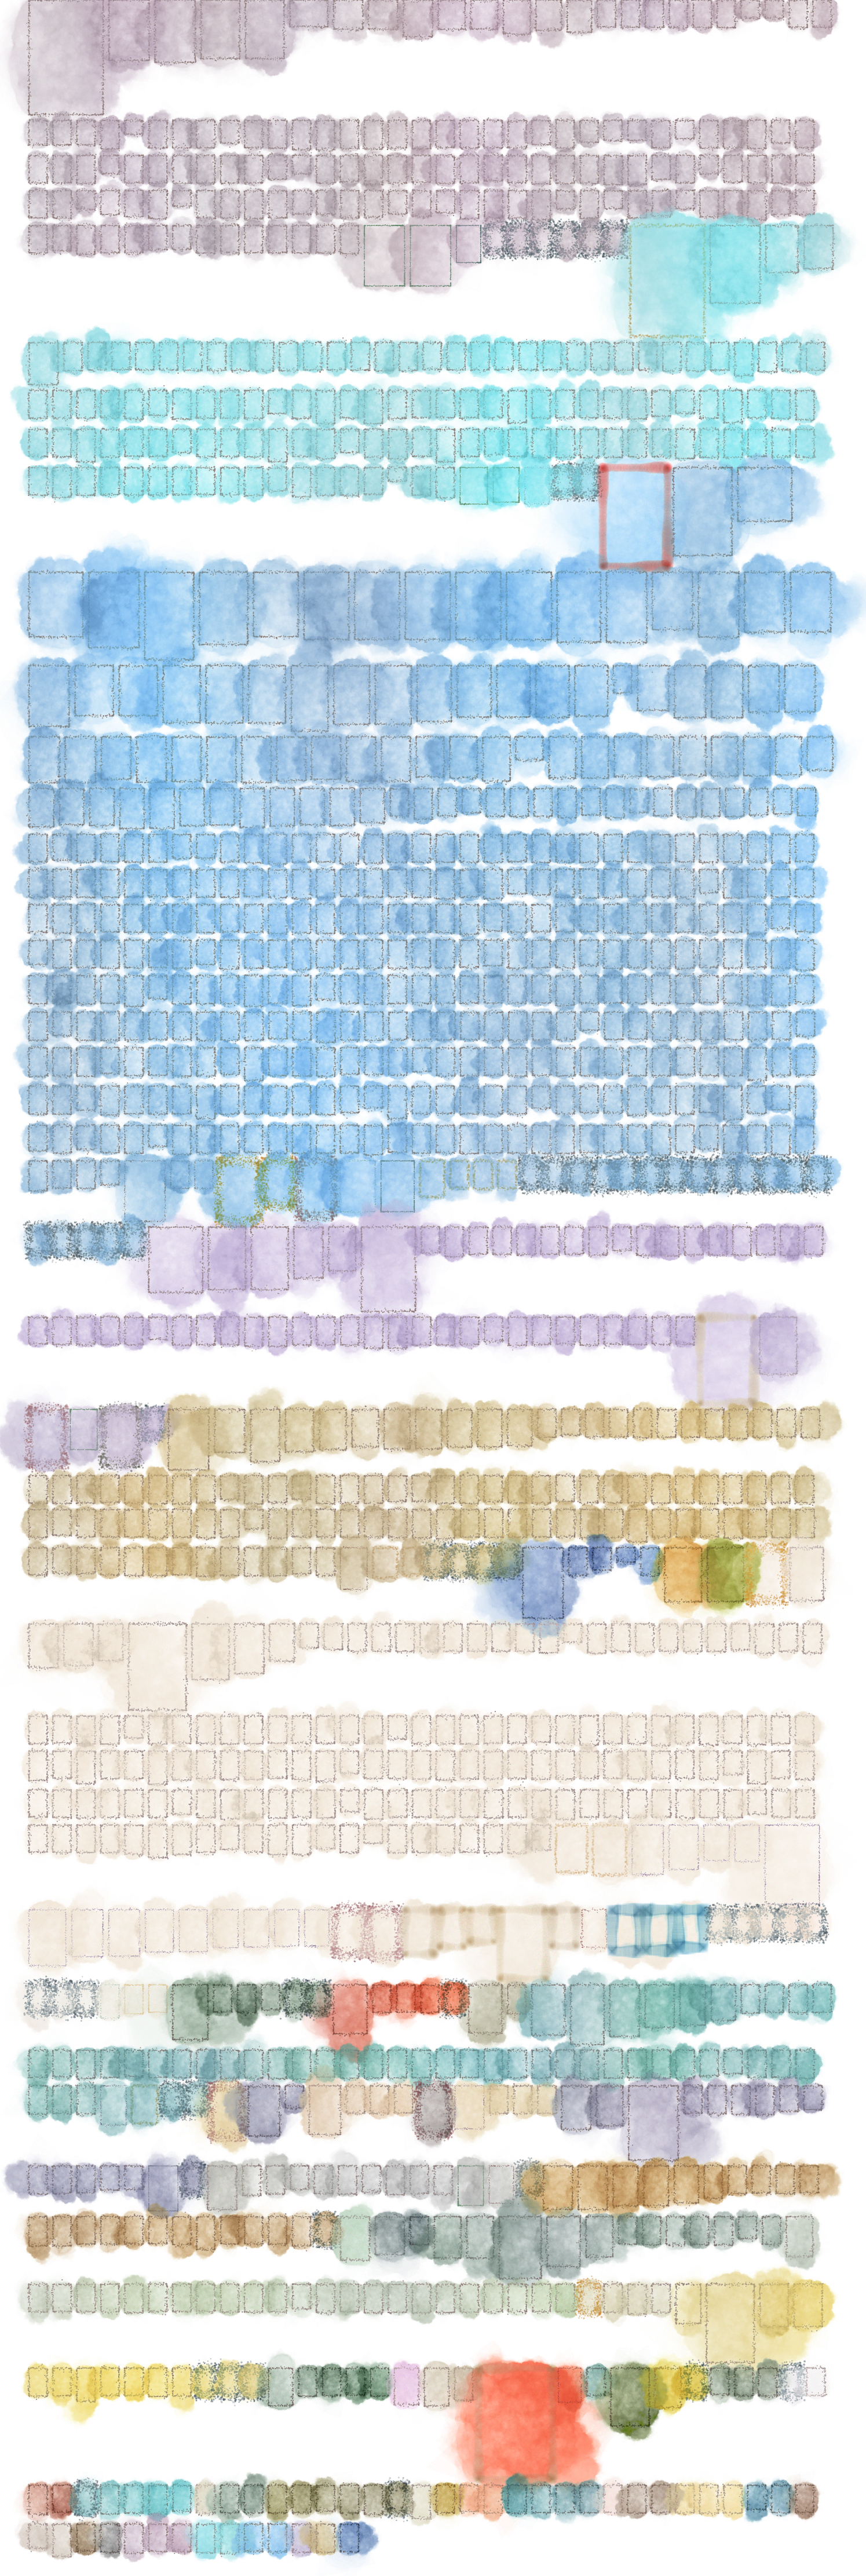
Genre Tag Library: Layout with books, showing the amount of sales, original language of publication, and commonly used genre tag words.
Rather than imposing our own interpretation, we preserved these community-generated labels, allowing their natural relationships to emerge. We were able to discern some interactions, like the structure between tags and books. Rather than simplifying them, we chose to adopt a clean and limited visualization, which would allow people to explore the whole picture themselves.
While our dataset draws from open-source information and doesn't capture every bestseller ever written, this limitation aligns with our philosophy: literary classification, like any categorization system, is incomplete and ever-evolving. We invite you to explore these connections and contribute your own observations to this ongoing dialogue.
Daria Koshkina - concept & creative direction, art direction, data search, analysis, visualization and web development programming
Yixuan Liu - data analysis, network science, visualization and programming
David Y. Stephenson, Belal Haikal - code review
Pedro Cruz - for our conversations and your ideas about data visualization
Avery Blankenship - for our conversations and your guidance on literary genres
Susannah Garden - text editing
Sagar Samanthapudi - for your data suggestions
×